
Six Footprint Views
Switch between Bid × Ask, Delta, Volume, Trades, Volume & Delta and Delta Profile from the on-chart VIEW menu. Your data is kept when you switch, so there is nothing to reload.
Early access · $100 off
See the volume traded at the bid and ask on every price level, with a session profile, stacked imbalance zones and signals that explain themselves.
$399 $299 early access · one-time · lifetime updates · no subscription
6 Views
Bid×Ask, Delta, Volume, Trades & more
8 Signals
Closed-bar order-flow rules, buy & sell
3 Zoom Levels
Candles, heat cells, full numbers
Level 1
All the data it needs. No Level 2.
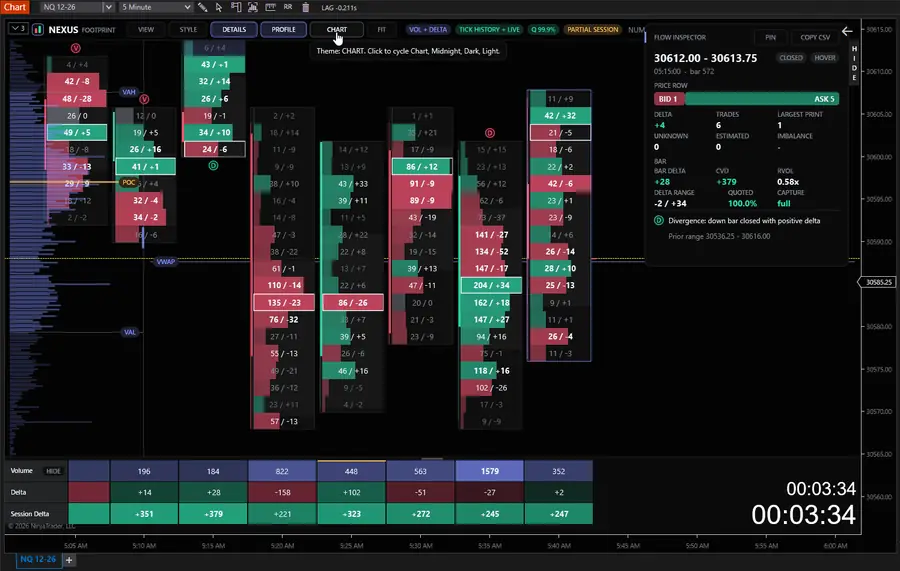
It shows who traded at each price inside every bar: volume at the bid versus the ask, the price with the most volume, where one side overwhelmed the other, and what that pressure did next.
Switch between Bid × Ask, Delta, Volume, Trades, Volume & Delta and Delta Profile from the on-chart VIEW menu. Your data is kept when you switch, so there is nothing to reload.
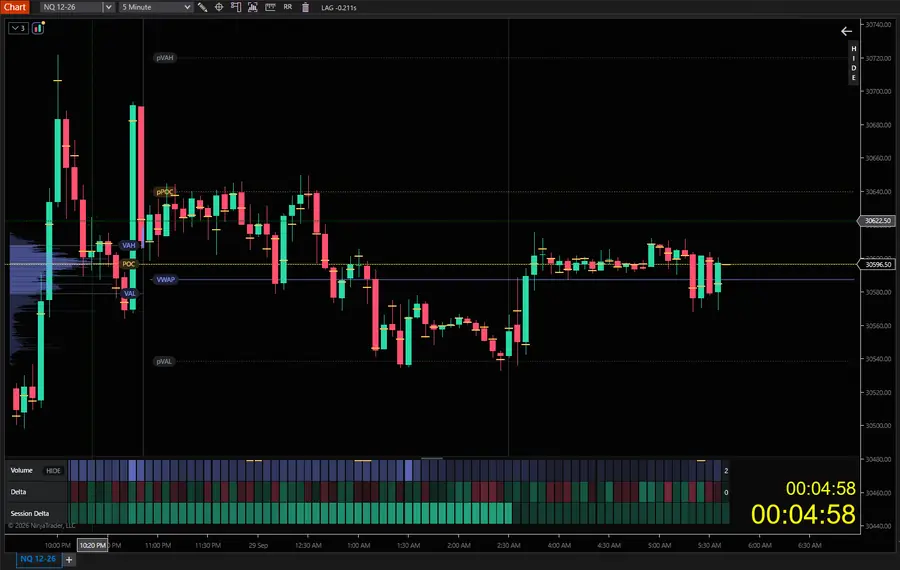
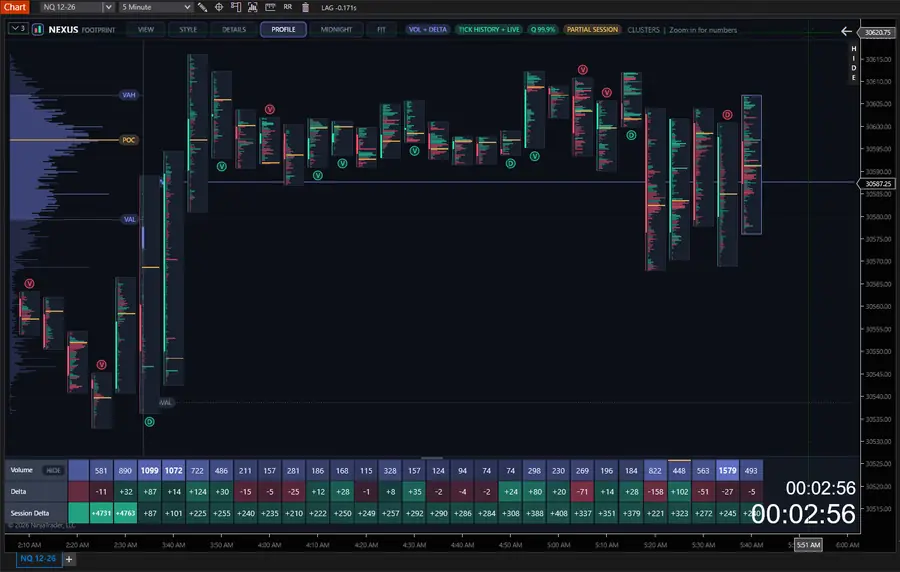
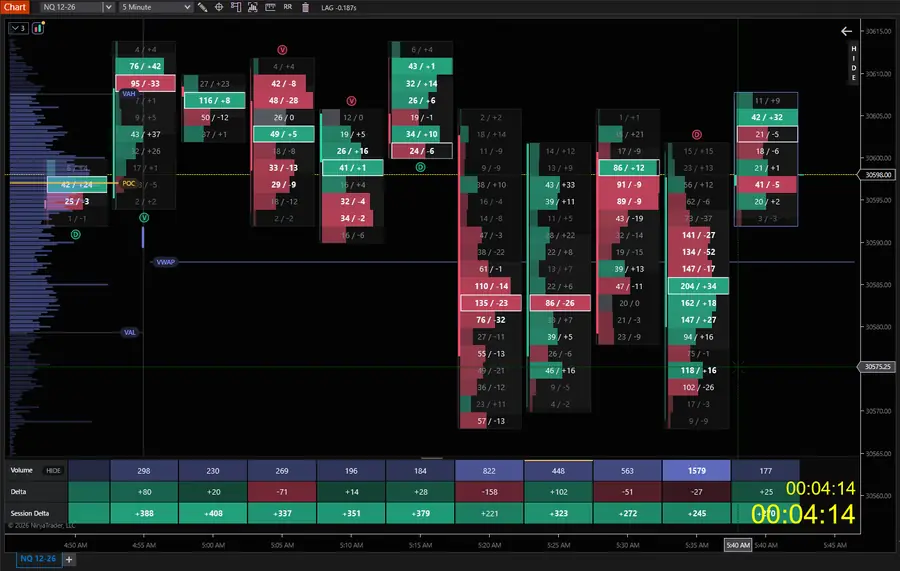
Zoomed out, bars draw as clean candles with a POC tick. At medium zoom, heat cells show where volume and imbalance sit. Zoom in and numbers appear as soon as they fit. Candles widen as you zoom.
Big prints are ringed in gold so size stands out at a glance. Turn on alerts to be notified when a completed bar fires a signal.
A session volume profile with POC, value area and VWAP draws over your bars without hiding them. Drag its edge to any width, and turn on previous-session levels for context.
Imbalances light up as they happen. When they stack, they become a zone that projects forward and tells you whether price respected it or broke it.
Order-flow events are marked on completed bars with a small letter. Hover any marker and it tells you in plain English what happened.
Open DETAILS for a full breakdown of any bar and price level, including delta, CVD and the largest print. Pin it, or copy the bar to CSV.
Volume, delta and session delta line up under every bar. Hover a cell for its exact value. Drag to resize it, or hide it with one click when you need the room.
The toolbar folds into a small brand mark and reappears when you hover it. The default theme adopts your chart's own background, with Midnight, Dark and Light themes one click away.
Real NinjaTrader 8 charts on NQ. The footprint adapts as you zoom, so it stays readable at every scale.
Eight signal families, each with a buy and a sell side. Signals are confirmed only when a bar closes, so they never appear and then vanish mid-bar.
| Marker | Signal | What it means |
|---|---|---|
| S+ S− | Stacked imbalance | One side dominated several price levels in a row. |
| A+ A− | Absorption candidate | Aggressive orders hit an extreme and price rejected them. |
| DIV | Delta divergence | The bar's direction and its delta disagree. |
| UA | Unfinished auction | The bar's extreme looks incomplete and may be revisited. |
| SW+ SW− | Sweep and reclaim | Price ran the recent range, then took it back. |
| CV+ CV− | CVD non-confirmation | A new price extreme that cumulative delta did not confirm. |
| T+ T− | Delta turn | Pressure flipped from one side to the other. |
| V+ V− | Value migration | Value keeps shifting in one direction bar after bar. |
Signals describe what happened in completed bars. They are not trade recommendations. Sensitivity is adjustable in the indicator settings.
Import once, then add it to any minute, second or tick chart.
Download it from the Downloads page, then in NinjaTrader go to Control Center → Tools → Import → NinjaScript Add-On.
Open a 1-minute chart, open Indicators, and add NexusIndicators → Nexus Footprint.
Zoom in until numbers appear. Use VIEW to pick a metric, STYLE for presets, and hover any cell or marker for exact values.
Early-access buyers pay $299 once instead of the regular $399, and keep every future update.
Early-access price · regular $399 · lifetime updates · no subscription
Secure checkout via PayPal · license tied to your NinjaTrader Machine ID · Windows 10/11 & NT8
Have questions before purchasing? Contact our support team.
Data feeds, chart types, signals and licensing.
No. Standard Level 1 market data is all it needs.
No. Nexus Footprint works on its own and does not need NinjaTrader's Order Flow+ or Volumetric Bars.
Last-price Minute, Second and Tick charts. Range, Renko, Volume and other rebuilt bar types are not supported yet; the indicator shows a clear message instead of guessing.
Any NinjaTrader 8 connection that provides historical tick data for your instrument. If tick history is not available for part of the chart, those bars show as plain candles. The indicator never invents footprint numbers from OHLC data.
It is built to stay light, even on busy instruments like NQ. You also control how many bars of footprint history are kept.
No. Signals describe what happened in completed bars and explain themselves when you hover them. They are educational tools, not buy or sell advice.
Yes. Key per-bar values such as delta, session delta and POC are exposed as plots that the Data Box and your own scripts can read.
Early-access buyers pay $299 once instead of the regular $399. It is the same lifetime license, with every future update included. The price moves to $399 when early access ends.
Yes. Each license is tied to your NinjaTrader Machine ID (Help > About in NinjaTrader). If you change computers, contact support and we will move the license to your new Machine ID.
Read the flow with Footprint, then act on it with the rest of the Nexus toolkit.
On-chart entries, visual brackets and account risk limits on the same chart as your footprint.
Put a footprint chart and your execution chart side by side in one resizable frame.
Log every trade automatically and review how your order-flow entries actually perform.