Execution and Risk Management
The Mathematics of Winning in Trading: Why Strategy is Only 40% of the Equation
"Most traders focus 90% of their energy chasing the perfect entry strategy, but the real edge in systematic trading comes from a mathematical trifecta: positive expectancy, risk control, and variance survival. If you do not manage the numbers, no setup in the world will save your account."
When you first enter the trading arena, the marketing engines of the industry point you toward a single focal point: the strategy. You are told that success is a matter of finding the right pattern, configuring the perfect indicator, or mastering the art of market structure. This creates a psychological trap. Traders spend years cycle-testing strategies, moving from moving average crossovers to order block theories, and eventually to order flow volume footprints, hoping to find the holy grail of execution.
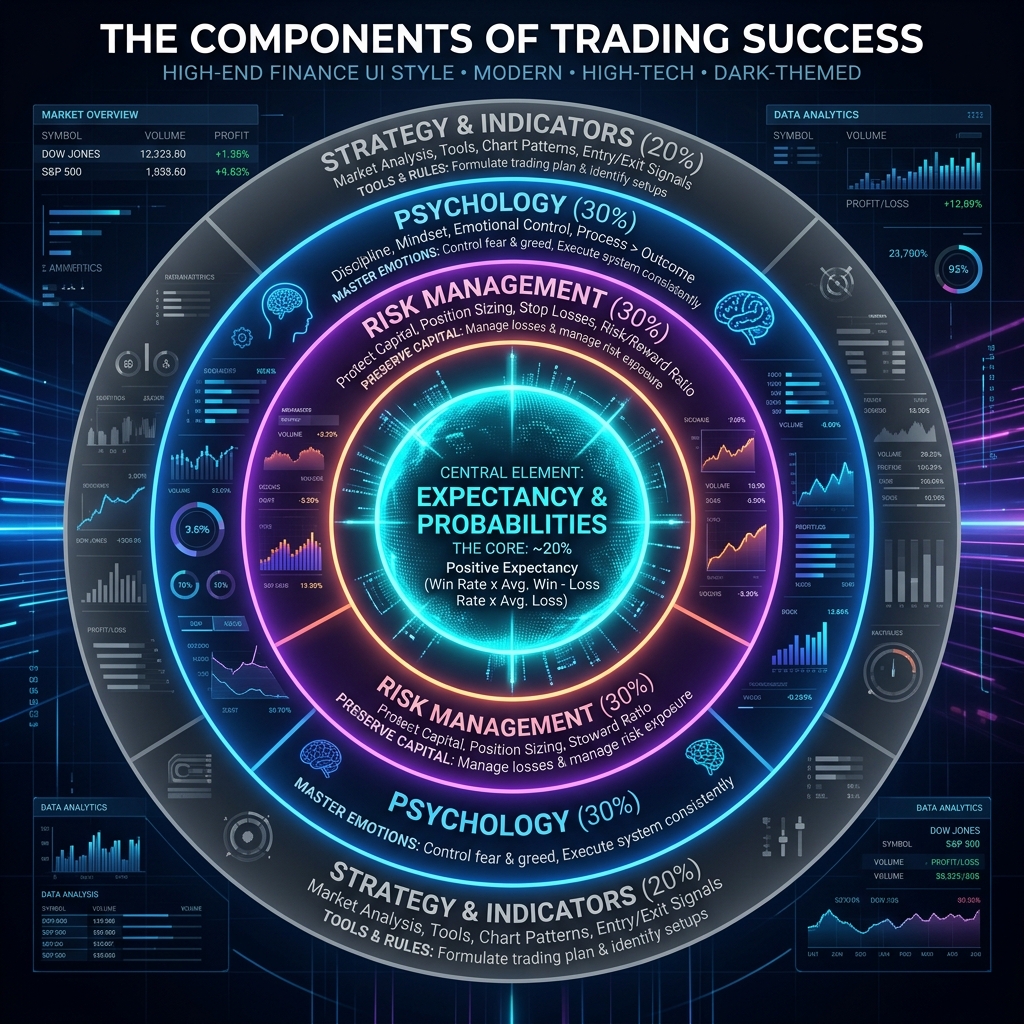
The hard truth, known by quantitative developers and institutional risk managers, is that strategy represents only about 40% of the trading success equation. The remaining 60% is pure mathematics: expectancy, variance, position sizing, and capital preservation. If you do not understand these four mathematical concepts, no matter what setups you use or how disciplined you try to be, you will never achieve consistent profitability.
In this comprehensive guide, we will break down the math of winning in trading. We will move beyond vague motivational advice and explore the exact formulas that govern systematic success, the psychological pitfalls of variance, and the technical infrastructure required to let the math work in your favor.
1. Concept One: Trading Expectancy (The Only Number That Matters)
Expectancy is the foundation of any trading business. It is a single, clear number that represents the average profit or loss you can expect to generate per trade over a large sample size. It filters out the noise of individual wins and losses, showing you the absolute commercial viability of your trading system.
Expectancy is not about how your last trade felt, how clean your last five setups were, or how confident you are in the market direction. It is a cold, mathematical calculation:
The Expectancy Formula
Expectancy = (Win Rate × Average Win) − (Loss Rate × Average Loss)
Where Win Rate + Loss Rate = 100%, and average values are expressed in currency or R-multiple units.
To understand why this formula is so powerful, let's examine three completely different trading systems and calculate their expectancy per trade. In these examples, we will assume a fixed risk of $500 per trade (1R = $500).
System A: The High-Reward, Low-Win-Rate Model
This system operates on an 8R target (reward-to-risk ratio of 8:1) but wins only 15% of the time. To a novice trader, losing 85% of their trades sounds like a total failure, but let's look at the math:
- Win Rate: 15% (0.15) | Loss Rate: 85% (0.85)
- Average Win: 8R × $500 = $4,000
- Average Loss: 1R × $500 = $500
- Expectancy = (0.15 × $4,000) − (0.85 × $500)
- Expectancy = $600 − $425 = +$175 per trade
Despite losing nearly 9 out of every 10 trades, this system generates an average of $175 of net profit per trade. Over a series of 100 trades, the system is mathematically projected to make $17,500.
System B: The Balanced Swing-Trading Model
This system targets a 3R reward-to-risk ratio with a 55% win rate. Let's calculate the expectancy:
- Win Rate: 55% (0.55) | Loss Rate: 45% (0.45)
- Average Win: 3R × $500 = $1,500
- Average Loss: 1R × $500 = $500
- Expectancy = (0.55 × $1,500) − (0.45 × $500)
- Expectancy = $825 − $225 = +$600 per trade
This balanced approach yields a high positive expectancy of $600 per trade. Over 100 trades, this system is projected to generate $60,000.
System C: The High-Win-Rate Scalping Model
This system focuses on quick, small wins, achieving a 70% win rate but with a 1R target (1:1 reward-to-risk):
- Win Rate: 70% (0.70) | Loss Rate: 30% (0.30)
- Average Win: 1R × $500 = $500
- Average Loss: 1R × $500 = $500
- Expectancy = (0.70 × $500) − (0.30 × $500)
- Expectancy = $350 − $150 = +$200 per trade
This system achieves a positive expectancy of $200 per trade. Over 100 trades, it generates $20,000.
When you compare System A (15% win rate) and System C (70% win rate), their expectancies are remarkably close ($175 vs. $200 per trade). This proves a core mathematical truth: win rate alone is meaningless, and reward-to-risk ratio alone is meaningless. It is the combination of the two that creates a sustainable trading edge.
Interactive Expectancy Calculator
Calculate your trading system's mathematical edge. Input your win rate, average win size, and average loss size to view your net expectancy.
For every dollar risked, your system returns a net positive value. Secure this edge with disciplined risk management.
The Real Expectancy vs. Paper Expectancy
Many traders construct backtests that show highly positive expectancies, only to blow accounts when trading live. This discrepancy is caused by ignoring transaction friction. Your expectancy on paper is a theoretical calculation. Your real expectancy must account for the execution costs of every single trade.
Every trade you execute incurs three main structural costs:
- Commissions: The fixed fees charged by your broker per contract or share.
- Spreads: The difference between the bid and ask price, which acts as an immediate cost when entering at market.
- Slippage: The difference between your requested entry price and the actual execution price, especially during periods of high volatility.
If your system has a paper expectancy of +$50 per trade, but your average transaction costs (commission, spread, and slippage) sum up to $60 per trade, your system is actually unprofitable. Over 1,000 trades, you will lose $10,000, even though your strategy was "profitable" in a backtest. This highlights the importance of keeping execution costs to an absolute minimum and utilizing native, high-performance desktop platforms, rather than laggy web-based interfaces, to route orders. For an in-depth look at this execution decay, you can read our comparison of TopstepX vs. NinjaTrader 8.
2. Concept Two: The Uncompromising Trade-Off (Win Rate vs. Reward-to-Risk)
The second mathematical law of trading is the inverse relationship between win rate and reward-to-risk ratio. Retail traders fail because they search for a strategy that offers both a 90% win rate and a 10R target. This search is a mathematical impossibility.
The market functions as a distribution mechanism. The further price has to travel to reach your profit target (high R-multiple), the less frequently it will succeed. Conversely, a tight profit target (low R-multiple) is hit frequently, resulting in a high win rate, but a single wide stop loss will wipe out multiple wins.
To establish where profitability begins, you must calculate the breakeven point for your system's reward-to-risk ratio. The formula is straightforward:
The Breakeven Win Rate Formula
Breakeven Win Rate = 1 ÷ (1 + R)
Where R is your reward-to-risk ratio (e.g., if target is 3R, R = 3).
Let's look at the required win rates across different R-multiples to break even:
| Target Ratio (R) | Breakeven Win Rate (%) | Required Win Rate to Profit (%) |
|---|---|---|
| 0.5R (Risk $100 to Win $50) | 66.6% | > 67.0% |
| 1.0R (Risk $100 to Win $100) | 50.0% | > 51.0% |
| 2.0R (Risk $100 to Win $200) | 33.3% | > 34.0% |
| 3.0R (Risk $100 to Win $300) | 25.0% | > 26.0% |
| 4.0R (Risk $100 to Win $400) | 20.0% | > 21.0% |
| 5.0R (Risk $100 to Win $500) | 16.7% | > 17.0% |
This table demonstrates the asymmetry of trading math. If your trading system is configured to capture a 4R target, you only need to be right more than 20% of the time to make money. You can be wrong 80% of the time and still run a profitable business. Yet, the average retail trader abandons a strategy after three consecutive losses, completely ignoring the underlying R-multiple math.
Finding the "Sweet Spot"
Success in trading is not about pushing to the mathematical extremes. Extreme high-win-rate systems (e.g., 90% win rate at 0.1R target) are vulnerable to "black swan" events, where a single large slippage event wipes out weeks of profits. Extreme high-reward systems (e.g., 10R targets with a 10% win rate) are psychologically devastating to execute. Traders cannot handle the long losing streaks that occur naturally in a low-win-rate system.
The professional sweet spot lies in the middle, typically between a 40% and 55% win rate combined with a 2R to 4R target. In this zone, the mathematical expectancy is robust, and the execution is psychologically sustainable. You do not need to win as often as you think, provided your risk controls are structured. To learn how to systematically align your targets using volatility, read our guide on Fixed vs. Variable RR Targets.
3. Concept Three: Variance (Why Traders Emotionally Fail)
Variance is the short-term deviation from the expected average. If your system has a 60% win rate, that does not mean you will win exactly 6 out of every 10 trades in every sequence. It means that over 1,000 trades, the distribution will converge toward 60%.
In the short term, the sequence of wins and losses is random. Let's look at three traders using the exact same trading system, with the exact same rules, and the exact same positive expectancy over a series of 100 trades. Their equity curves will look completely different due to variance:
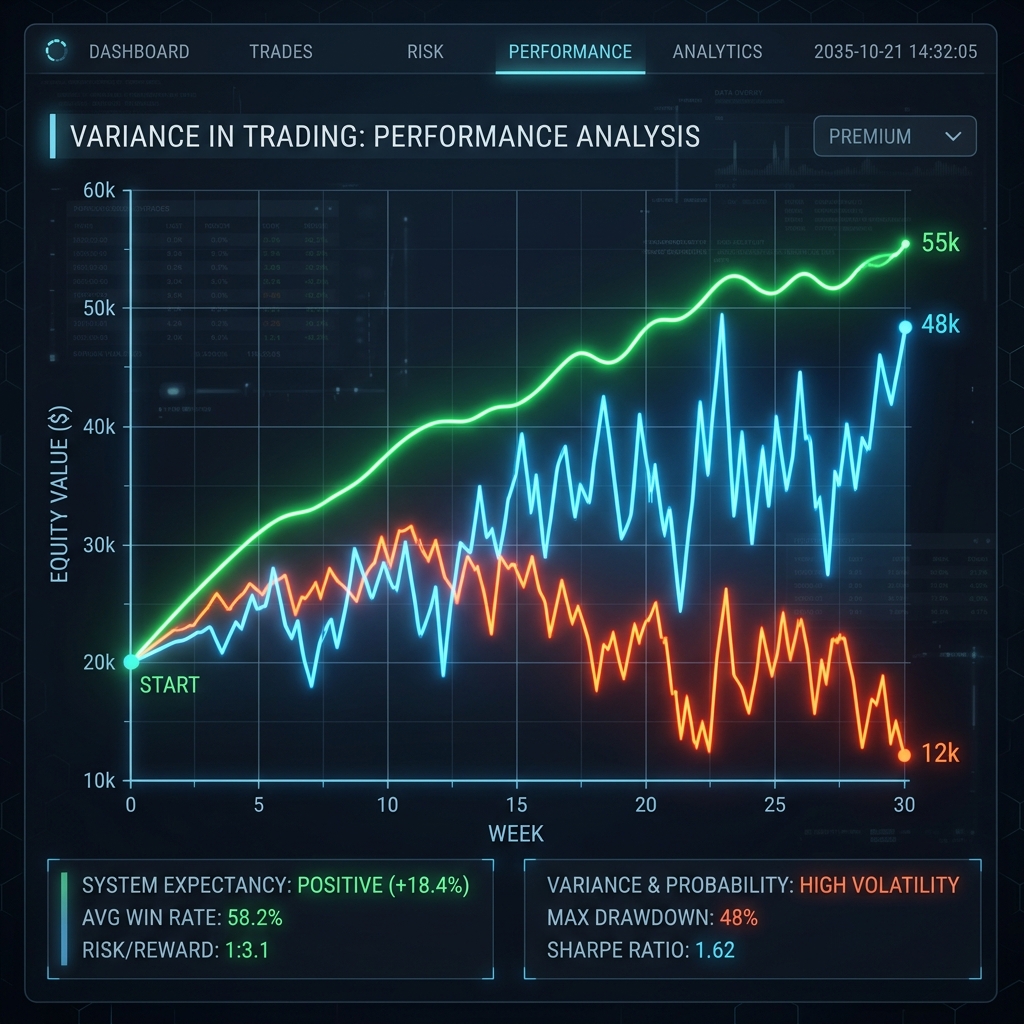
One trader gets a smooth upward trajectory, enjoying a positive sequence of returns. The second trader experiences a brutal initial drawdown, encountering a cluster of consecutive losses. The third trader chops sideways for 50 trades before the curve rises. This represents the reality of variance.
If you are the second trader, in the middle of a drawdown, you will start questioning your parameters. You will search for a new strategy, change indicators, or abandon your setups, believing the edge has stopped working. Meanwhile, the first trader is executing the exact same system and enjoying profits. This is why traders fail: they confuse short-term variance with long-term performance.
The Danger of Short-Term Outcomes
Short-term trading outcomes prove absolutely nothing. This truth cuts both ways:
- Good execution can result in a loss: You can execute a setup perfectly according to your rules, manage the trade flawlessly, and still lose. That is a normal statistical event. A single trade is a 50/50 probability, a coin flip.
- Bad execution can result in a win: You can break every rule in your playbook, over-leverage, remove your stop loss, and win five trades in a row. This is the most dangerous event in a trader's career. It teaches the brain that bad behavior is rewarded, leading to massive size increases right before the inevitable drawdown wipes out the account.
Only a large sample size reveals the truth. You must evaluate your trading results in blocks of 100 trades, not trade-by-trade. If you judge your system after 5 or 10 trades, you are letting variance dictate your business decisions.
The Gambler's Fallacy in Trading
The gambler's fallacy is the belief that if a random event has occurred frequently in the past, the opposite event is "due" to happen. In trading, it manifests like this: "I have taken four consecutive losses, so the fifth trade has a much higher probability of winning."
This is a cognitive trap. If your strategy has a 50% win rate, every single trade is an independent event. The probability of the fifth trade winning is still exactly 50%. The market has no memory of your last four trades. The fact that you lost $2,000 this morning does not increase the probability of your next trade making money.
Traders who fall into this fallacy double their position size on the fifth trade to recoup their losses, expecting a win. When that trade also loses, they blow their account. Understanding that every trade is independent is essential for surviving the distribution curve.
4. Concept Four: Risk Control and Asymmetric Recovery
None of the mathematical concepts we have covered matter if you do not survive long enough for your edge to play out. Risk management is where discipline becomes visible on your equity curve. The foundation of risk control is dynamic position sizing.
Professional traders never risk a random number of contracts or lots. They risk a fixed percentage of their account balance, or a fixed dollar amount, per trade. Because the distance of your stop loss changes on every trade based on market structure and volatility, your position size must adjust to keep the dollar risk constant.
The Dynamic Position Sizing Formula
Position Size (Contracts) = Dollar Risk ÷ (Stop Loss Distance in Ticks × Tick Value)
For example, if you risk $500 on a Nasdaq (NQ) trade, and your stop loss is 40 ticks wide (10 points × 4 ticks/point), with a tick value of $5: Position Size = $500 / (40 × $5) = 2.5 contracts. You round down to 2 contracts to stay under your risk threshold.
By adjusting your size based on volatility, you ensure that a wide stop loss does not lose more money than a tight stop loss. To automate this calculation inside NinjaTrader 8 using ticks, see our comprehensive guide on Tick ATR Position Sizing.
The Asymmetric Recoup Curve (The Math Works Against You)
In trading, losses and gains are not equal. This asymmetry is the most dangerous mathematical trap in finance. When you lose capital, the percentage gain required to recover to your starting balance grows exponentially:
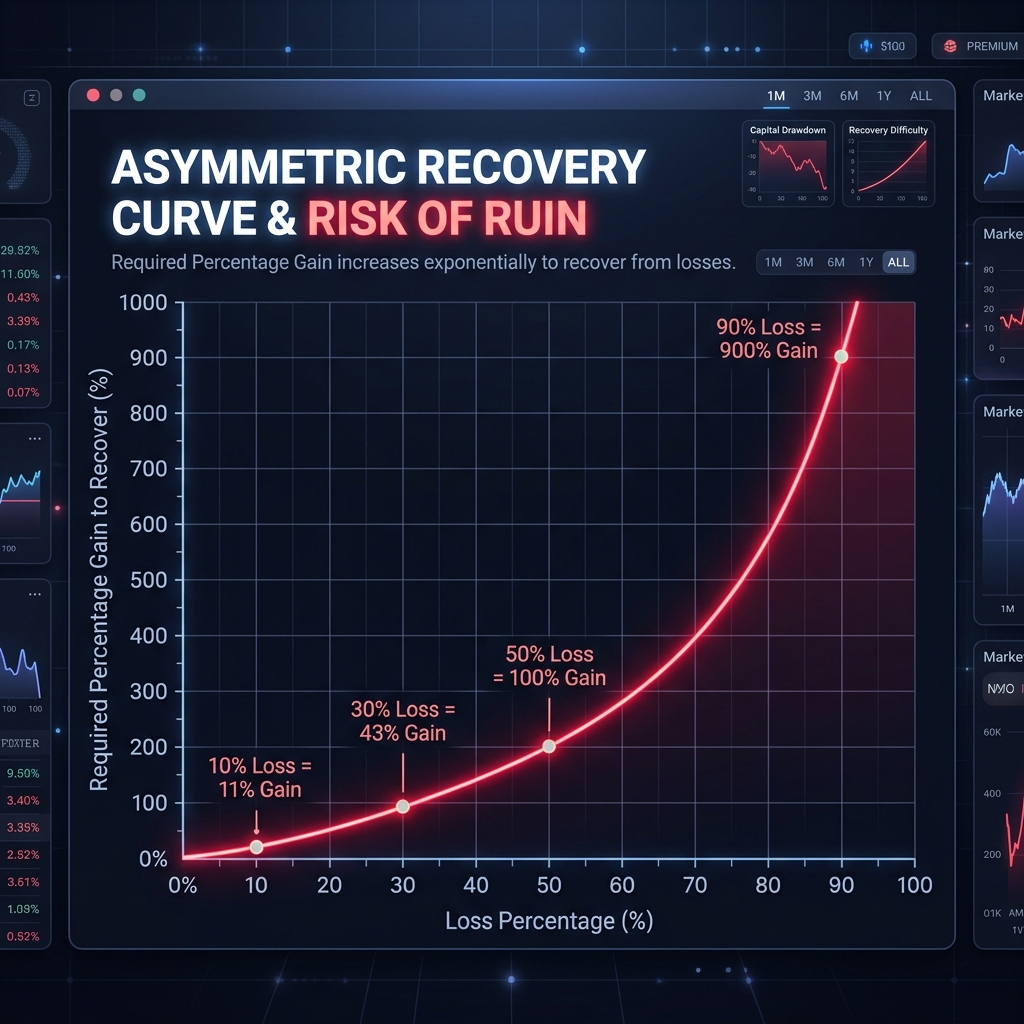
If you lose 10% of your account, you need an 11.1% gain to break even. If you lose 30%, you need a 42.9% gain. If you lose 50%, you need a 100% gain, meaning the market expects you to double your remaining capital just to get back to zero.
If you take a 90% drawdown, you need a 900% gain to recover. For 99% of retail traders, a 900% return is mathematically impossible to achieve before tilting and blowing the remaining 10%. This exponential curve is why protecting your capital is the absolute priority of systematic trading. The moment you enter a deep drawdown, the math works against you.
Drawdown Recovery Calculator
Input a percentage drawdown to calculate the required gain to recover back to breakeven, and see how the math aggressively compounds against you.
You must perform 43% better than your losses just to return to a zero balance. Capital preservation is critical.
The Risk of Ruin
The risk of ruin is the probability that your account balance will reach zero (or your prop firm's maximum drawdown limit) before your positive expectancy edge can play out. The primary variable that controls the risk of ruin is your risk-per-trade percentage.
If you risk 5% of your account per trade, you only need a sequence of 10 consecutive losses to blow the account (excluding the trailing drawdown mechanics which make it even faster). A sequence of 10 losses is a statistical certainty over a series of 1,000 trades, even for a 60% win rate system. If you risk 0.5% per trade, you need 100 consecutive losses to blow the account, which has a near-zero probability. Risking between 0.25% and 2.0% per trade is the professional standard to survive the variance of the market.
5. Moving from Willpower to Infrastructure
If you understand the concepts of expectancy, variance, and asymmetric recovery, you must ask yourself one simple question: What is the one thing you know you are doing wrong that, if fixed, would completely change your trading?
Most traders already know the answer. They know they judge their strategy after a few bad trades. They know they risk too much because they seek the emotional rush of a big win. They know they abandon their edge when variance appears, or they double their position size after a sequence of losses. Yet, despite knowing this, they continue to repeat the same errors.
This is because discipline is a finite cognitive resource. When you sit in front of screens, tracking order flow during high-impact market events, your brain's prefrontal cortex eventually fatigues. When you tilt, your logical mind shuts down, and your emotional mind takes over. In that split second, you cancel your stop, hit buy market with double size, and blow your funded account.
You cannot solve a cognitive limitation with willpower. You must solve it with infrastructure. You need software systems that enforce the math of trading, physically preventing you from violating your risk plan when you are tilted.
Common Pitfall
Relying on mental stop losses or basic platform settings to manage risk. When market volatility spikes or emotional tilt kicks in, traders manually override their brackets, double their size, or restart their platform to bypass voluntary limits.
Professional Routine
Utilizing automated risk engines integrated directly into the desktop execution terminal. Enforcing strict, tamper-proof daily loss limits, mandatory cooldown timers, and automated profit protectors to remove human emotion from capital preservation.
Automating the Math with Nexus Chart Trader
Professional traders treat risk management as software-defined rules. The Nexus Chart Trader execution dashboard for NinjaTrader 8 is designed to turn the mathematical concepts we have covered into automated execution guardrails:
- Tamper-Proof Daily Risk Locks: Enforces your maximum daily loss and profit limits. Once hit, the software flattens your positions, cancels working orders, and locks your account. These locks survive NinjaTrader restarts, preventing you from reopening the platform and over-trading.
- Profit Protector System: Enforces a profit-lock mechanism. When a configurable trigger threshold is met (e.g., $1,000), the system secures a minimum protected profit level (e.g., $700). If the market reverses, your positions are flattened, and your profit is preserved.
- Global Loss Cooldown: Enforces a mandatory cooling-off period (e.g., 30 minutes) after a loss before you can execute another trade. The timer only starts when your positions are flat, preventing you from adding to losing trades.
- Settlement Cooldown: Enforces a mandatory execution delay between fills, protecting your account against high-frequency slippage and API sync lag during extreme news volatility.
- News Lock System: Automatically fetches news data from Forex Factory and locks execution (flattening positions and cancelling pending orders) before high-impact economic events, protecting your capital from news spikes.
By incorporating these automated guardrails into your NinjaTrader 8 setup, you transition from relying on fragile human willpower to using a robust, systematic risk management infrastructure. This allows the positive expectancy of your system to play out over a large sample, safe from the destructive effects of emotional variance.
Frequently Asked Questions
What is trading expectancy and why is it important?
Trading expectancy is the mathematical average net result you can expect per trade over a large sample size. It is calculated by multiplying your win rate by your average win, and subtracting your loss rate multiplied by your average loss. It is the only metric that confirms whether your trading system is commercially viable.
How does variance affect a positive expectancy trading system?
Variance represents the short-term deviation from your expected average win rate. Even with a system that wins 60% of the time, variance dictates that you will encounter clusters of losses in the short term, including consecutive losing streaks. If a trader does not manage risk per trade, variance can blow an account before the long-term edge can play out.
What is the gambler's fallacy in trading?
The gambler's fallacy is the belief that past random events influence future probabilities. In trading, this occurs when a trader believes that after a string of losses, the next trade is "due" to win. In reality, each trade is an independent event, and the win probability remains constant.
How do I calculate the required recovery gain after a drawdown?
The required recovery gain is calculated as: Gain Required = Loss % / (1 - Loss %). For example, a 30% loss requires a 42.9% gain to break even, while a 50% loss requires a 100% gain. This asymmetry is why capital preservation is critical.
Master Your Execution
Call to action description goes here. Direct the user to a specific Nexus tool.
Upgrade Your WorkflowValentin V.
Lead Quantitative Developer • Nexus Indicator • GitHub • LinkedIn
Valentin V. is the Lead Quantitative Developer at Nexus Indicator, specializing in developing high-precision tools and indicators for NinjaTrader 8. With over a decade of experience in C# and NinjaScript, he has helped hundreds of prop firm traders professionalize their execution workflows through technical discipline, systematic risk management, and automation.