Strategy Analysis
The Institutional Footprint: How to Trade Volume Spikes.
"Price is the story, but volume is the truth. When the smart money moves, they leave a footprint that cannot be hidden."
In the world of electronic trading, retail traders often find themselves chasing shadows. We watch the price move up and down, reacting to every tick, often feeling like we're one step behind the "smart money." But there is one metric that institutions cannot hide, no matter how sophisticated their algorithms: Volume.
Volume represents the total number of shares or contracts traded during a specific period. It is the fuel that moves the market. Without volume, price movements are hollow and prone to immediate reversal. When you see a massive spike in volume, you are witnessing the "footprint" of institutional players, banks, hedge funds, and high-frequency trading firms, entering or exiting the market.
Why Volume Spikes Matter
Most traders look at volume as a simple histogram at the bottom of their chart. They see green and red bars and assume green means buying and red means selling. This is a common misconception. A red volume bar simply means the price closed lower than it opened; it doesn't tell you who was in control.
A Volume Spike occurs when the activity in a single bar significantly exceeds the recent average. These spikes are critical because they signal a change in the status quo. They often occur at major structural levels, during news events, or at the start/end of a major trend.
The Absorption Signature
Look for high volume at a price level with very little price progress. If the delta is highly negative but price is holding a support level, the 'Whales' are buying. This is a primary long signal. For more on this, see our Whale Cloud guide.
3 Strategies for Trading Volume Spikes
1. The Breakout Validator
Most breakouts fail. Retail traders see a level break and jump in immediately, only to be stopped out by a "fakeout." To increase your win rate, only take breakouts that are supported by a volume spike. If the price breaks a major resistance level but the volume is lower than average, the institutions aren't participating.
2. The Climax Reversal
When price has been trending for a significant period and suddenly produces its largest volume spike of the session, look for a reversal. This is the "stopping volume." Institutions are exiting, and the retail "latecomers" are providing the liquidity for them to do so.
3. Rejection at Supply/Demand
Combine volume spikes with market structure. If the price returns to a previously established Nexus Level and we see a volume spike followed by a rejection candle, this is a high-probability entry.
Automated Detection
The Nexus Volume indicator automatically highlights bars that exceed 2.0x the average volume, ensuring you never miss an institutional footprint.
Psychological Edge
Learning to read volume transforms you from an emotional participant into a clinical observer of institutional intent.
Conclusion: Upgrade Your Vision
If you aren't looking at volume, you're trading with one eye closed. Volume spikes are the most objective data point available to a technical trader. They represent real money being committed to the market. By using tools like Nexus Volume to automate this analysis, you remove the guesswork and focus on what truly matters: following the institutional footprint.
Stop Guessing. See the Volume.
Get Nexus Volume for NinjaTrader 8 and start detecting institutional activity in real-time.
Get Nexus Volume Now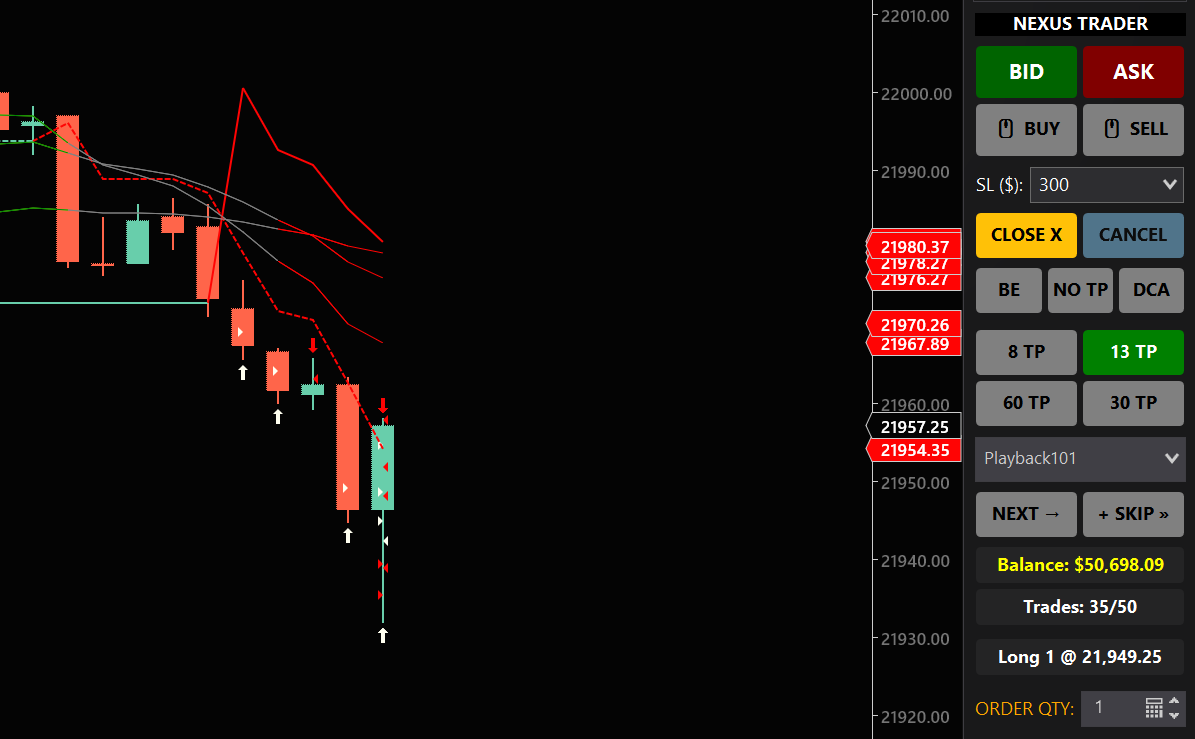
V
V is the Lead Quantitative Developer at Nexus Indicator. He has helped multiple prop firm traders professionalize their execution workflows through technical discipline.